Tip: The "Drops vs Ingredients" search shows you data about how many drops (X-axis) included which ingredients (Y-axis), and -- if they were scored -- how many of them were scored a particular way. The "Drops vs pH" search shows you the same data but with the pH along the X-axis. The "Screens Used in Experiments" search shows you the experiments that used a particular screen -- you select the screens of interest by using the Instant Filters panel on the right-hand side of your screen.

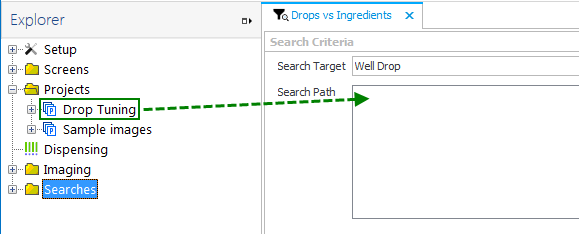
Drag a project or experiment to the Search Path field
A chart will appear on your screen

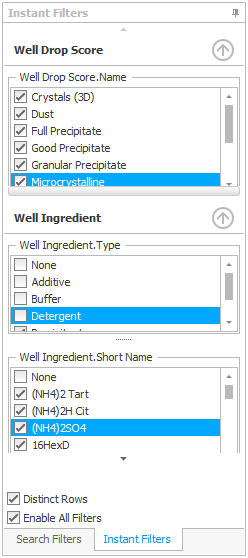
Instant Filters panel

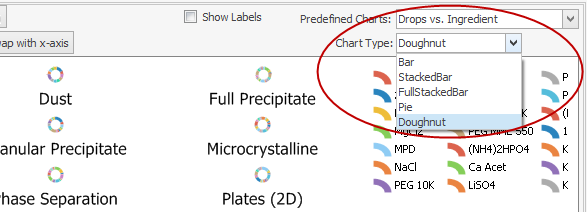
Change the chart type
Tip: While you cannot save changes to sample searches, you can recreate them if you find one you like. To do so, take note of the selection in "Search Target" field (top-center of your screen) and the names and categories on the "Instant Filters" panel (right side of your screen). When you create a new search and filter, find those same names and categories on the "Search Fields" tab (left side of your screen), and drag them to the Instant Filters panel.